| As of August 2020 the site you are on (wiki.newae.com) is deprecated, and content is now at rtfm.newae.com. |
Difference between revisions of "Simulating the XMEGA Target Code"
(Added descriptions to images) (Tag: VisualEditor) |
|||
| (4 intermediate revisions by 2 users not shown) | |||
| Line 1: | Line 1: | ||
This page describes how to simulate the XMEGA target code in order to determine the length of time AES takes. This was designed for the CHES CTF 2016, but may be valuable in other circumstances. | This page describes how to simulate the XMEGA target code in order to determine the length of time AES takes. This was designed for the CHES CTF 2016, but may be valuable in other circumstances. | ||
| − | =Required Tools= | + | ==Required Tools== |
You will require the following tools: | You will require the following tools: | ||
| Line 8: | Line 8: | ||
* avr-gcc (suggested to use WinAVR, but you can actually build with Atmel Studio) | * avr-gcc (suggested to use WinAVR, but you can actually build with Atmel Studio) | ||
| − | =Simulating= | + | ==Simulating== |
| − | The following assumes you have an EXTERNAL build environment (such as WinAVR, or avr-gcc). | + | The following assumes you have an EXTERNAL build environment (such as WinAVR, or avr-gcc). Building with Atmel Studio is possible, but not documented/supported right now. |
| − | == Opening Object File == | + | === Opening Object File === |
To begin, we'll be opening the existing .elf file. This file contains all the debug information created during the build process. | To begin, we'll be opening the existing .elf file. This file contains all the debug information created during the build process. | ||
| − | # From the File --> Open menu, select Open Object File For Debugging: | + | # From the File --> Open menu, select Open Object File For Debugging: |
| − | # Select your ELF-file built previously: | + | #:[[File:sim1_openobject.png]] |
| − | # This will prompt you to save a project. Give it a location somewhere: | + | #: |
| − | # Select the ''<code>XMEGAD</code>'' as the family, and the <code>ATxmega128D4</code> as the specific device: | + | # Select your ELF-file built previously: |
| − | # Your project will now open. You should be able to click on a source file to see the contents: | + | #:[[File:sim2_selectelf.png]] |
| + | #: | ||
| + | # This will prompt you to save a project. Give it a location somewhere: | ||
| + | #:[[File:sim3_saveproject.png]] | ||
| + | # Select the ''<code>XMEGAD</code>'' as the family, and the <code>ATxmega128D4</code> as the specific device: | ||
| + | #:[[File:sim4_selectxmega.png]] | ||
| + | # Your project will now open. You should be able to click on a source file to see the contents: | ||
| + | #:[[File:sim5_openfile.png]] | ||
Great - now let's look into how we can simulate this project. | Great - now let's look into how we can simulate this project. | ||
| − | == Simulating == | + | === Simulating === |
| − | # On the tool-bar, there is an open to select the debug interface. It may say "No Tool" as below, if so click to select the tool: | + | # On the tool-bar, there is an open to select the debug interface. It may say "No Tool" as below, if so click to select the tool: |
| − | # And select the "Simulator" option: | + | #:[[File:sim7_selecttoolA.png]] |
| − | # You're ready to simulate! As a first example, you can set Breakpoints by clicking in the margin. If they can be set a red circle will appear. Be very careful in location - sometimes once you go to simulate the breakpoints will be disabled or moved (more on this later), so you'll have to go back and check the location of them once the simulator is running: | + | #:<br> |
| − | # To start the simulator, select the "Start Debugging" option: | + | # And select the "Simulator" option: |
| − | # But what happens? You'll likely see NO break-point hit! This is because the code is waiting on the serial port. Go back to the source-file and add a call to the AES encryption operation, just as it would be called later. The following shows the location to add this to in the <code>simpleserial-aes.c</code> file: | + | #:[[File:sim8_selecttoolB.png]] |
| − | # Recompile. Atmel Studio should flag the object file as changed (NB: only if using external project, if building through Atmel Studio these messages don't appear), if so hit "Reload": | + | #:<br> |
| − | # You can now try debugging again, and should see the break-point hit. But what good is that? To see the cycle count, open the "Processor Status" window:[[File:sim12_pstatus.png]] | + | # You're ready to simulate! As a first example, you can set Breakpoints by clicking in the margin. If they can be set a red circle will appear. Be very careful in location - sometimes once you go to simulate the breakpoints will be disabled or moved (more on this later), so you'll have to go back and check the location of them once the simulator is running: |
| − | # This window has a field called ''Cycle Counter'', which is the current clock cycle count. When a breakpoint is hit you can read this field: | + | #:[[File:sim6_setbreakpoint.png]] |
| − | # You can also clear it, writing it to 0 for example at the start of the encryption operation: | + | #:<br> |
| − | # Back to simulating. If you try setting a break-point, you might get an '''open circle''' as below. Note this appeared to be set OK, until we hit ''Debug'' at which point it turned into the open circle! '''<u>This breakpoint will NEVER be hit.</u>'''[[File:sim15_bpnothit.png]] | + | # To start the simulator, select the "Start Debugging" option: |
| − | # Instead, you should set a break-point at the higher level code. You can use ''Step Over'' and ''Step into'' to work your way through the code. The following example shows that for the first S-Box substitution, this code is taking almost 1800 cycles. Each run through this loop was taking far too long - the result being that the S-Boxes '''would not''' be covered by the 10 000 samples taken by the CTF system.[[File:sim16_stepin.png]] | + | #:[[File:sim9_startdebug.png]] |
| + | #:<br> | ||
| + | # But what happens? You'll likely see NO break-point hit! This is because the code is waiting on the serial port. Go back to the source-file and add a call to the AES encryption operation, just as it would be called later. The following shows the location to add this to in the <code>simpleserial-aes.c</code> file: | ||
| + | #:[[File:sim10_insertcall.png]] | ||
| + | #:<br> | ||
| + | # Recompile. Atmel Studio should flag the object file as changed (NB: only if using external project, if building through Atmel Studio these messages don't appear), if so hit "Reload": | ||
| + | #:[[File:sim11_reload1.png]] | ||
| + | #:[[File:sim11_reload2.png]] | ||
| + | #:<br> | ||
| + | # You can now try debugging again, and should see the break-point hit. But what good is that? To see the cycle count, open the "Processor Status" window: | ||
| + | #:[[File:sim12_pstatus.png]] | ||
| + | #:<br> | ||
| + | # This window has a field called ''Cycle Counter'', which is the current clock cycle count. When a breakpoint is hit you can read this field: | ||
| + | #:[[File:sim13_cyclecount.png]] | ||
| + | #:<br> | ||
| + | # You can also clear it, writing it to 0 for example at the start of the encryption operation: | ||
| + | #:[[File:sim14_resettozero.png]] | ||
| + | #:<br> | ||
| + | # Back to simulating. If you try setting a break-point, you might get an '''open circle''' as below. Note this appeared to be set OK, until we hit ''Debug'' at which point it turned into the open circle! '''<u>This breakpoint will NEVER be hit.</u>''' | ||
| + | #:[[File:sim15_bpnothit.png]] | ||
| + | #:<br> | ||
| + | # Instead, you should set a break-point at the higher level code. You can use ''Step Over'' and ''Step into'' to work your way through the code. The following example shows that for the first S-Box substitution, this code is taking almost 1800 cycles. Each run through this loop was taking far too long - the result being that the S-Boxes '''would not''' be covered by the 10 000 samples taken by the CTF system. | ||
| + | #:[[File:sim16_stepin.png]] | ||
| + | #:<br> | ||
That's it! Using the Atmel Studio, you can easily simulate your code to determine the number of cycles taken for certain operations. To summarize key points: | That's it! Using the Atmel Studio, you can easily simulate your code to determine the number of cycles taken for certain operations. To summarize key points: | ||
| Line 42: | Line 72: | ||
* Set a breakpoint at the higher-level code, as this is where the trigger starts. Check how many cycles it takes to reach the first vulnerable portion of your code. | * Set a breakpoint at the higher-level code, as this is where the trigger starts. Check how many cycles it takes to reach the first vulnerable portion of your code. | ||
| + | ===Building=== | ||
| − | + | At this time, it is recommended to use WinAVR to build. The version of certain tools provided with Atmel Studio does not directly work with the provided Makefile. | |
| + | |||
| + | See [[http://wiki.newae.com/CHES2016_CTF#Compiling_Firmware_as_Server_Does]] for brief details. You can use the built ELF-file as above. | ||
Latest revision as of 06:42, 1 May 2018
This page describes how to simulate the XMEGA target code in order to determine the length of time AES takes. This was designed for the CHES CTF 2016, but may be valuable in other circumstances.
Required Tools
You will require the following tools:
- Atmel Studio 7
- avr-gcc (suggested to use WinAVR, but you can actually build with Atmel Studio)
Simulating
The following assumes you have an EXTERNAL build environment (such as WinAVR, or avr-gcc). Building with Atmel Studio is possible, but not documented/supported right now.
Opening Object File
To begin, we'll be opening the existing .elf file. This file contains all the debug information created during the build process.
- From the File --> Open menu, select Open Object File For Debugging:
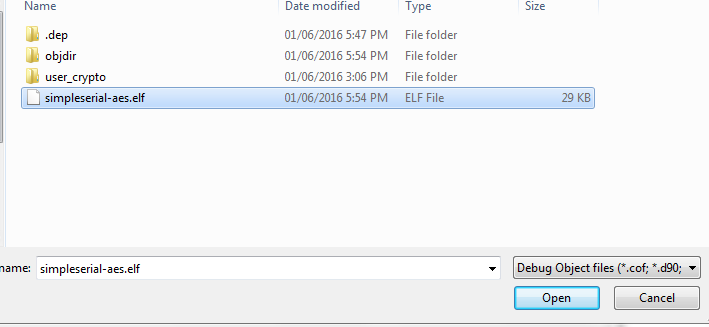
- Select your ELF-file built previously:
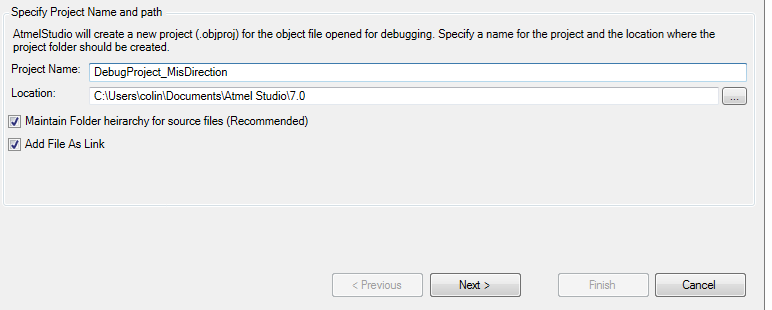
- This will prompt you to save a project. Give it a location somewhere:
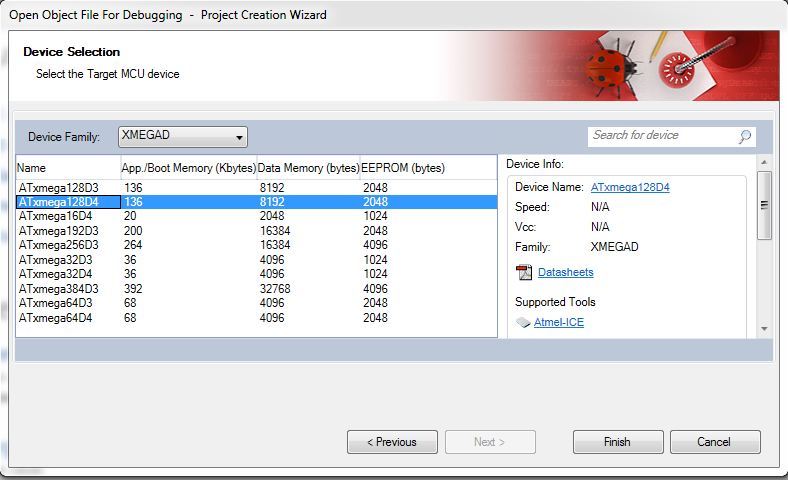
- Select the
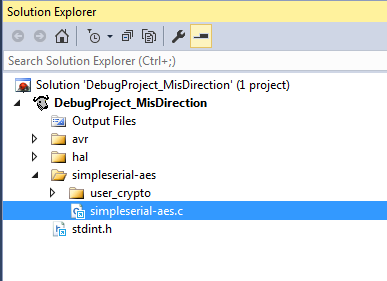
XMEGADas the family, and theATxmega128D4as the specific device: - Your project will now open. You should be able to click on a source file to see the contents:
Great - now let's look into how we can simulate this project.
Simulating
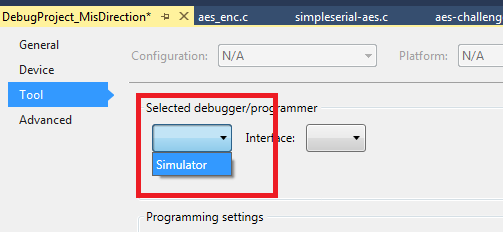
- On the tool-bar, there is an open to select the debug interface. It may say "No Tool" as below, if so click to select the tool:
- And select the "Simulator" option:
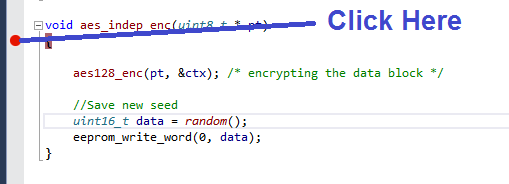
- You're ready to simulate! As a first example, you can set Breakpoints by clicking in the margin. If they can be set a red circle will appear. Be very careful in location - sometimes once you go to simulate the breakpoints will be disabled or moved (more on this later), so you'll have to go back and check the location of them once the simulator is running:
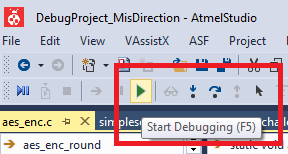
- To start the simulator, select the "Start Debugging" option:
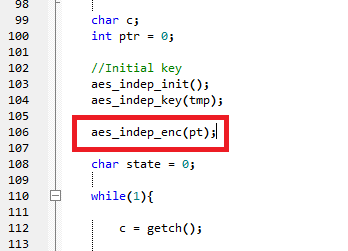
- But what happens? You'll likely see NO break-point hit! This is because the code is waiting on the serial port. Go back to the source-file and add a call to the AES encryption operation, just as it would be called later. The following shows the location to add this to in the
simpleserial-aes.cfile: - Recompile. Atmel Studio should flag the object file as changed (NB: only if using external project, if building through Atmel Studio these messages don't appear), if so hit "Reload":
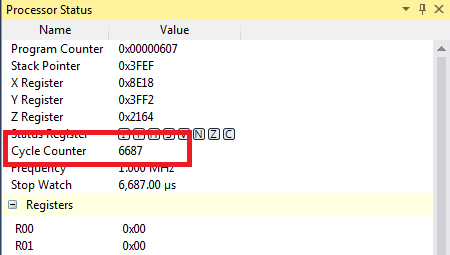
- You can now try debugging again, and should see the break-point hit. But what good is that? To see the cycle count, open the "Processor Status" window:
- This window has a field called Cycle Counter, which is the current clock cycle count. When a breakpoint is hit you can read this field:
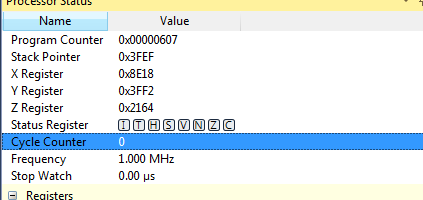
- You can also clear it, writing it to 0 for example at the start of the encryption operation:
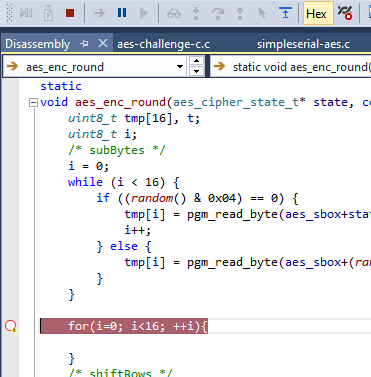
- Back to simulating. If you try setting a break-point, you might get an open circle as below. Note this appeared to be set OK, until we hit Debug at which point it turned into the open circle! This breakpoint will NEVER be hit.
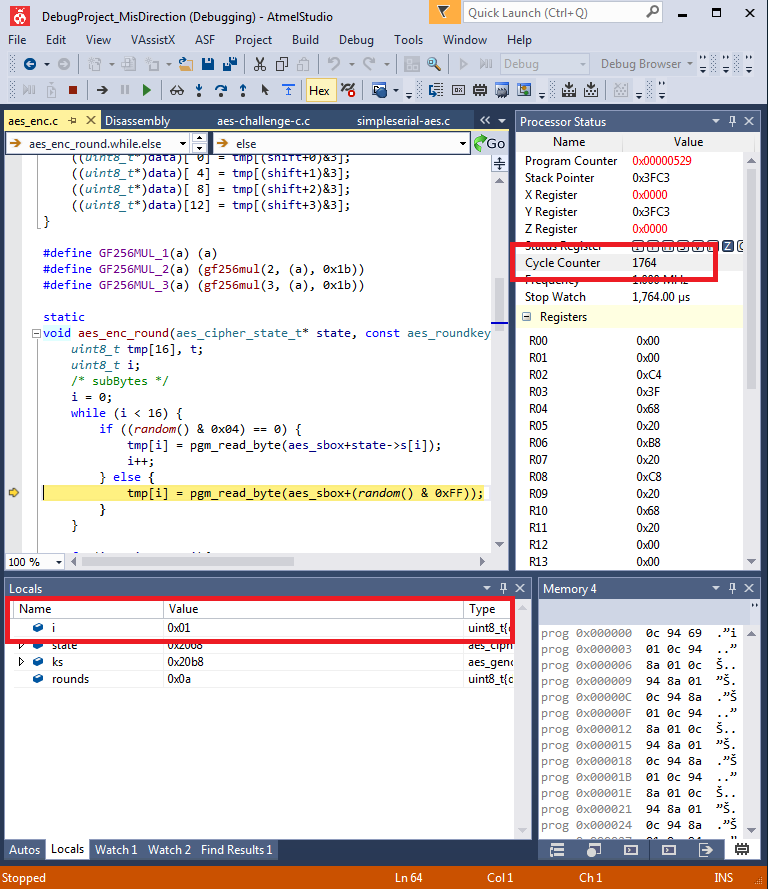
- Instead, you should set a break-point at the higher level code. You can use Step Over and Step into to work your way through the code. The following example shows that for the first S-Box substitution, this code is taking almost 1800 cycles. Each run through this loop was taking far too long - the result being that the S-Boxes would not be covered by the 10 000 samples taken by the CTF system.
That's it! Using the Atmel Studio, you can easily simulate your code to determine the number of cycles taken for certain operations. To summarize key points:
- Use the framework described by the CTF page, which provides the required makefile + supporting files.
- You'll have to modify the
simpleserial-aes.cfile to directly call your encryption function. - Set a breakpoint at the higher-level code, as this is where the trigger starts. Check how many cycles it takes to reach the first vulnerable portion of your code.
Building
At this time, it is recommended to use WinAVR to build. The version of certain tools provided with Atmel Studio does not directly work with the provided Makefile.
See [[1]] for brief details. You can use the built ELF-file as above.

