| As of August 2020 the site you are on (wiki.newae.com) is deprecated, and content is now at rtfm.newae.com. |
Difference between revisions of "CW-Capture Tool"
From ChipWhisperer Wiki
(Tag: VisualEditor) |
(→The Basic) (Tag: VisualEditor) |
||
| Line 14: | Line 14: | ||
The capture tool comes with a list of built-in scripts to connect to different pairs of target-scope hardwares. The easiest way to start using it is accessing the "Project"->"Example Scripts" menu and select the appropriate item in the list. | The capture tool comes with a list of built-in scripts to connect to different pairs of target-scope hardwares. The easiest way to start using it is accessing the "Project"->"Example Scripts" menu and select the appropriate item in the list. | ||
| − | If you want more advanced setups, you will have to configure | + | If you want more advanced setups, you will have to configure the capture environment manually using the Setting tabs, starting with the "Generic Settings": |
# Select the "Scope Module" (i.e: ChipWhisperer/OpenADC). Leave it as None if you just want to use the target. | # Select the "Scope Module" (i.e: ChipWhisperer/OpenADC). Leave it as None if you just want to use the target. | ||
# Select the "Target Module" (i.e.: Simple Serial). Leave it as None if you just want to use the scope. | # Select the "Target Module" (i.e.: Simple Serial). Leave it as None if you just want to use the scope. | ||
Revision as of 08:54, 15 July 2016
This tool captures traces from scopes while is also capable of synchronize it with different targets devices.
Main features:
- View the wave form of each trace;
- Save/load/import/edit/manage the traces;
- Run custom capture scripts;
- Automated glitch exploring with a nice scatterplot widget to visualize the result;
- Convenient firmware programmer to flash files to the target board;
- Record traces using fixed/random encryption keys and fixed/random plaintext inputs;
- Serial Terminal
The Basic
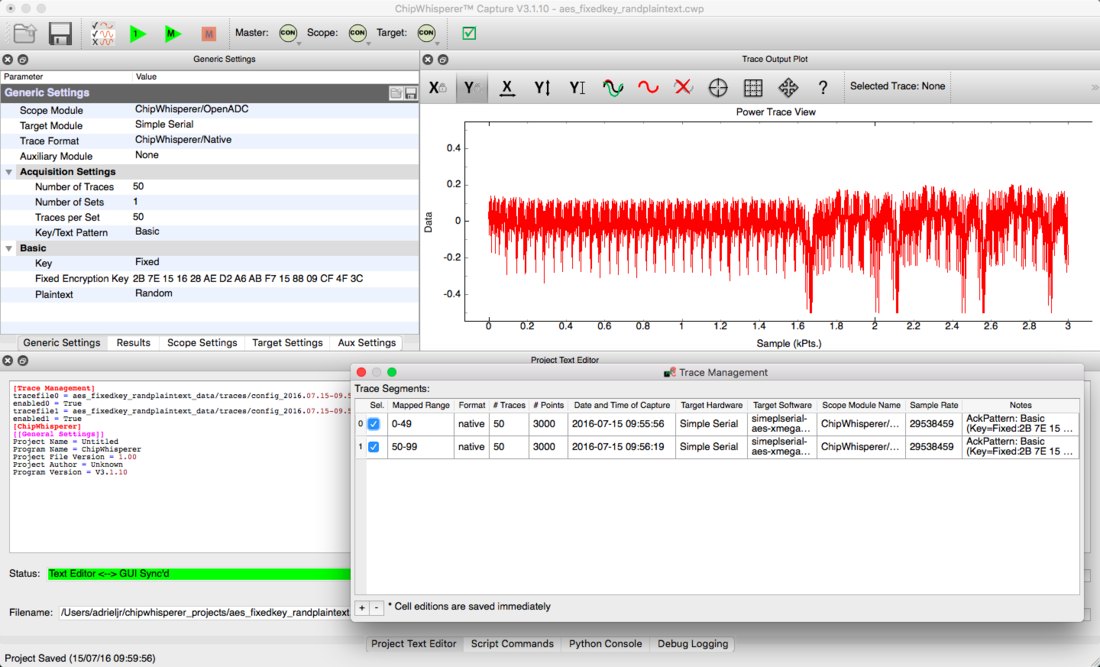
The capture tool comes with a list of built-in scripts to connect to different pairs of target-scope hardwares. The easiest way to start using it is accessing the "Project"->"Example Scripts" menu and select the appropriate item in the list.
If you want more advanced setups, you will have to configure the capture environment manually using the Setting tabs, starting with the "Generic Settings":
- Select the "Scope Module" (i.e: ChipWhisperer/OpenADC). Leave it as None if you just want to use the target.
- Select the "Target Module" (i.e.: Simple Serial). Leave it as None if you just want to use the scope.
- Select the "Trace Format" (i.e.: ChipWhisperer/Native). Leave it as None if you don't need to save the traces, as often happen when executing the Glitching attack.
- Switch to the "Scope Settings" tab and setup your scope connection (i.e. selecting 'NewAE USB (CWLite/CW1200)').
- Switch to the "Target Settings" tab and setup your target connection (i.e. selecting 'NewAE USB (CWLite/CW1200)').
- Connect to the desired scope/target pair, using the toolbar buttons. The master button connects to both at the same time.
- At this point, you may want to flash the desired firmware to the target, using the Programmer option in the Tools' menu.
- Once connected, both the "Scope Settings" and "Target Settings" list of parameters may expand, giving access to more advanced settings. You will have to setup these parameters which depend on what you want to capture. It usually involves setting the following parameters:
- Trigger Pins
- Target IOn Pins
- Target HS IO-Out
- Clock Setup
- Trigger Setup->Total Sample
- Trigger Setup->Offset
- Trigger Setup->Mode
- Gain
- Relock/reset the DCM in case it is lost.
- You may want to check if everything is working properly by clicking in the "Capture 1" button and adjusting the above settings if necessary.
- Once the traces output is working as expected, you can set the "Generic Settings"->"Ackisition Settings"->"Number of Traces" option to the desired amount (i.e. 50-100) and click the "Capture M" button in the toolbar. This time the traces will be saved to the "Trace Manager" if you specified a "Trace Format".
- In order to view the saved traces, you will have to change the "Result"->"Trace Output Plot"->"Input" from the scope channel to the "Trace Manager".
- You can also import, delete, edit or select/deselect the trace segments by opening the "Trace Manager" in the Project menu.
- Don't forget to save the Project after each change in the traces. A "Consolidate" option is also available to move/copy all the trace files to the current project directory. It is useful if you imported existing traces or captured it before creating the project.
Tutorials
Follow the B5 tutorial to learn how to use it with different targets.
