| As of August 2020 the site you are on (wiki.newae.com) is deprecated, and content is now at rtfm.newae.com. |
Plotting Widget
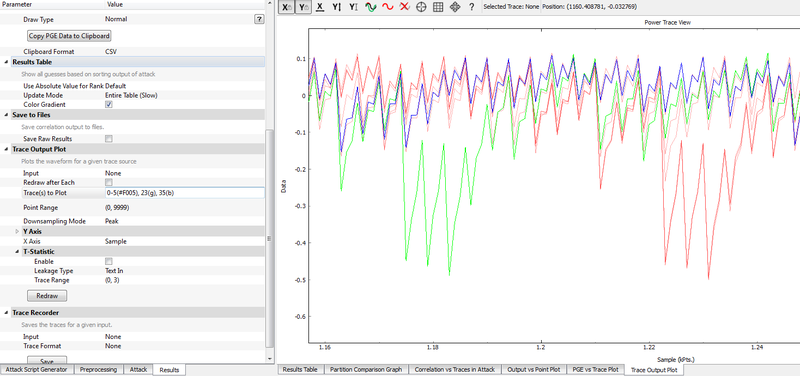
The plotting widgets are used for displaying data & results in ChipWhisperer. The following shows an example usage of a trace plot:
Release 3.3.0 and earlier only allowed you to plot a range of traces. Release 3.4.0 and later now allow you to specify a wide range of details about the plot, with a "plot command". You can specify ranges, individual traces, and colours.
Plot Commands
The new versions of ChipWhisperer now support a "Plot Command". This has a string field called Trace(s) to Plot which you can do things like the following in:
| Plot Command | Result |
|---|---|
| 0 | Plots trace #0 |
| 0-10 | Plots trace #0 - #10 inclusive |
| 0, 2-5, 9 | Plots trace #0, #2-5 inclusive, and #9 |
| 0(r), 3-6(g), 22(b) | Plots trace #0 in red, #3-#6 in green, and #22 in blue |
| 2(#F005) | Plots trace #2 in red (RGB=F00) with Alpha of 0.3125 |
| 3(#B0171F) | Plots trace #3 in 'india red' |
Inside the () is the "colour string". Those are passed to pyqtgraph.myPen, which accepts the following by default:
| Colour String | Description | Example |
|---|---|---|
| c | One of r, g, b, c, m, y, k, w | k (plots in black) |
| RGB | Hexadecimal string, may begin with # | |
| RGBA | Hexadecimal string with alpha value (may also being with #) | #F005 |
| RRGGBB | #B0171F | |
| RRGGBBAA |
Note using the "alpha" value can be handy to see where multiple traces are overlapping. Using an alpha of around 0.2 means trace paths taken once will be hardly visible, but paths taken multiple time will appear much brighter. Note the order of traces in the plot command is the order they are drawn in, so you can also choose which items overlap in which order.
