Tutorial B5 Breaking AES (Straightforward)
This tutorial has been updated for ChipWhisperer 4.0.0 release. If you are using 3.x.x see the "V3" link in the sidebar.
| B5: Breaking AES (Straightforward) | |
|---|---|
| Target Architecture | XMEGA/ARM |
| Hardware Crypto | No |
| Software Release | V3 / V4 / V5 |
This tutorial will take you through a complete attack on a software AES implementation. The specific implementation being attacked is a well-known AES implementation written in C, which is likely to be similar to other implementations used by proprietary systems.
Capturing
This tutorial runs on four different hardware targets. You only need to follow the steps for your given hardware.
Capturing with ChipWhisperer-Lite/Pro with default XMEGA Target (CW303)
WARNING: This video was recorded with API V3.x, some changes happened so please take note.
NOTE: You can see a Quick-Start Guide and Video for this target on the CW1173_ChipWhisperer-Lite page:
Hardware Setup
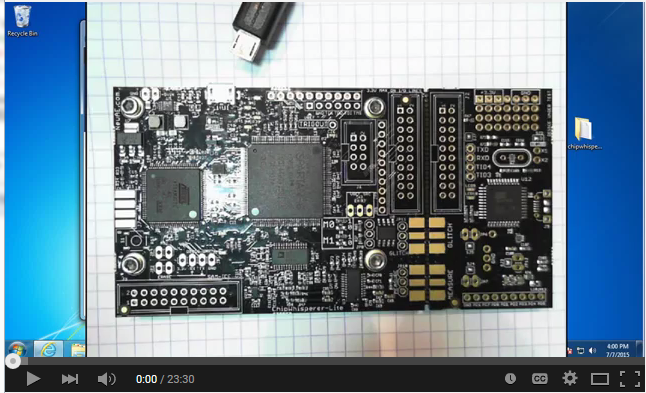
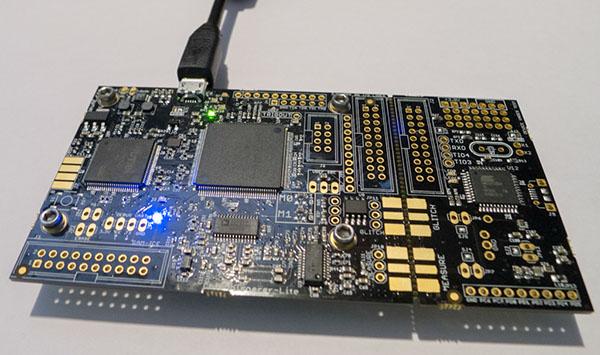
Connect the CW1173/CW1200 by USB cable to computer.
- The software AES implementation that will run on the target is located in
chipwhisperer\hardware\victims\firmware\simpleserial-aes. In a terminal window, navigate here and run the commandmaketo build the firmware. As in previous tutorials, ensure that the firmware has been built for the correct board. Here, the output ofmakeshould end likeAVR Memory Usage ---------------- Device: atxmega128d3 Program: 3078 bytes (2.2% Full) (.text + .data + .bootloader) Data: 352 bytes (4.3% Full) (.data + .bss + .noinit) Built for platform CW-Lite XMEGA -------- end --------
Like before, if you're using the ARM target, use
make PLATFORM=CWLITEARM CRYPTO_TARGET=TINYAES128C.Make sure that the platform is correct.
- Upload the firmware to the target chip. The process to do this is the same as the previous tutorials:
- Open the ChipWhisperer Capture software.
- Connect to the ChipWhisperer. (You can do this using a script or by filling out the generic settings and connecting to the board yourself.)
- Open the XMEGA Programmer (**Tools > ChipWhisperer-Lite XMEGA Programmer**), or, if you're using the ARM target, open the STM32F Programmer.
- Find the hex file you compiled and program it onto the target.
Capturing the Traces
- Switch to the Python Console tab.
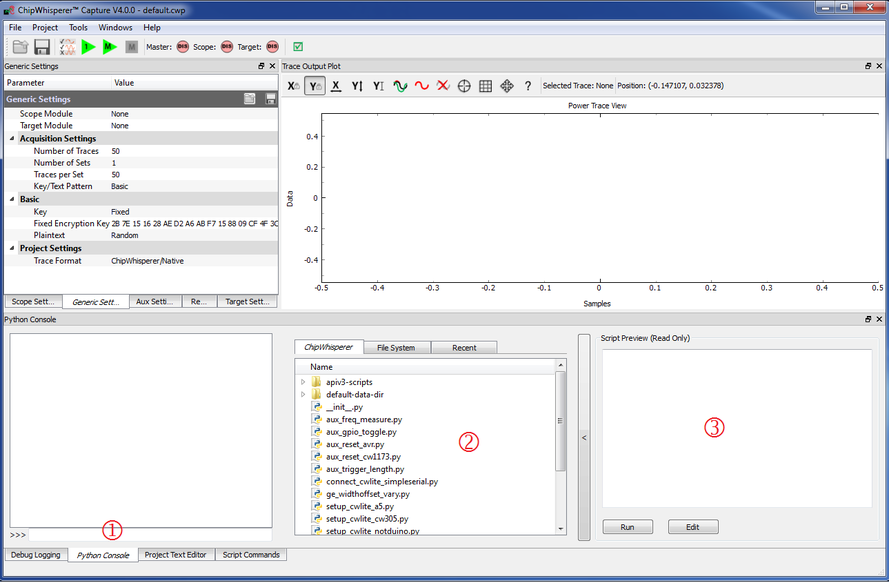
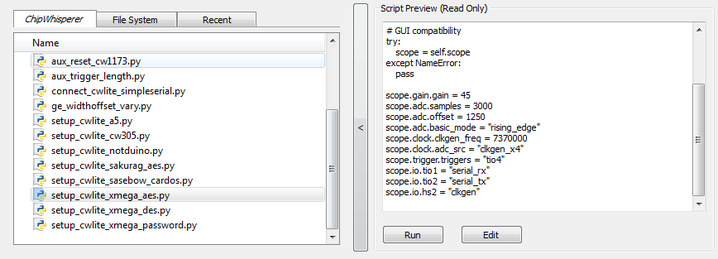
- The script selection window (2) lists available example scripts. Scroll down to "connect_cwlite_simpleserial.py" and click on it.
- You will see the script contents appear in the "Script Preview" window (3). You can either hit the "Run" button or double-click the filename of the script to execute it. Do either of those now.
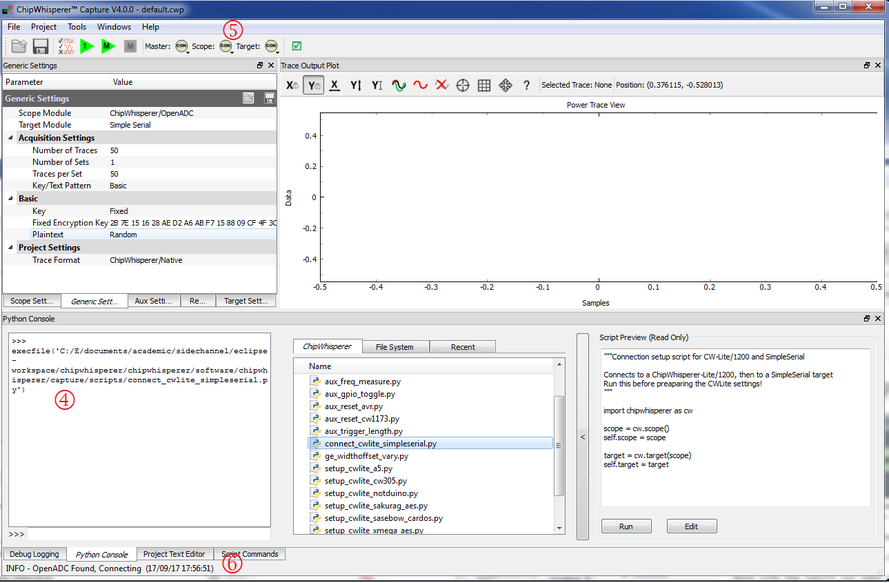
The window should change to indicate the connect succeeded:
- The console lists the exact script that is executed. Note you could have manually executed the script commands line-by-line in this console.
- The "Scope" and "Target" buttons will show as connected.
- The Status Bar will show a connection.
Note in previous software versions, this tutorial took you through manual setup. This can still be done (using the GUI), but instead now the API has been made more powerful, so the example configuration script will be used instead.
To do so, simply scroll down and select the "setup_cwlite_xmega_aes.py" if you're using the XMEGA target. If you're using the ARM target, select "setup_cwlite_stm32f_aes.py":
To complete the tutorial, follow these steps:- Switch to the General Settings tab
- If you wish to change the number of traces, do so here. The default of 50 should be sufficient to break AES though!
- Hit the Capture Many button (M in a green triangle) to start the capture process.
- You will see each new trace plotted in the waveform display.
- You'll see the trace count in the status bar. Once it says Trace 50 done (assuming you requested 50 traces) the capture process is complete.
- Finally save this project using the File --> Save Project option, give it any name you want.
- Skip ahead to #Analyzing_the_Traces.
Capturing with ChipWhisperer-Lite and UFO Board
TODO
Analyzing the Traces
Opening File & Viewing Traces
- Open the Analyzer software
- From the File --> Open Project option, navigate to the .cwp file you save previously. Open this file.
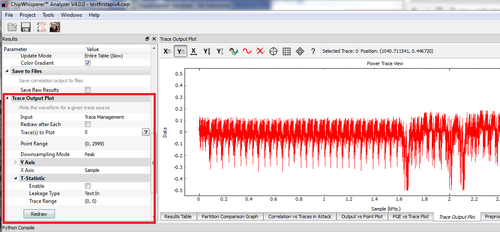
- Switch to the Trace Output Plot tab on the right side.
- Switch to the Results setting tab on the left side
- Scroll down to the Trace Output Plot setting, highlighted below:
- You can choose to plot a specific range of traces. For example type 0-10 in the Trace(s) to plot window.
- Hit the Redraw button when you change the trace plot range.
- You can right-click on the waveform to change options, or left-click and drag to zoom.
- Use the toolbar to quickly reset the zoom back to original.
- Try more advanced plotting options, like 0(r),4-7(b) to plot trace 0 in red, and 4-6 in blue. See a full list of possible commands on the page Plotting_Widget.
Running Attack Script
In ChipWhisperer V4.0, we now use attack scripts for everything. As in the capture program, switch to the Python Console tab & find the attack scripts. There may be additional scripts there, but you should find one called "attack_cpa.py". It has the following contents:
import chipwhisperer as cw
from chipwhisperer.analyzer.attacks.cpa import CPA
from chipwhisperer.analyzer.attacks.cpa_algorithms.progressive import CPAProgressive
from chipwhisperer.analyzer.attacks.models.AES128_8bit import AES128_8bit, SBox_output
from chipwhisperer.analyzer.preprocessing.add_noise_random import AddNoiseRandom

#self.project = cw.openProject("2017-mar23-xmega-aes.cwp")
traces = self.project.traceManager()

#Example: If you wanted to add noise, turn the .enabled to "True"
self.ppmod[0] = AddNoiseRandom()
self.ppmod[0].noise = 0.05
self.ppmod[0].enabled = False

attack = CPA()
leak_model = AES128_8bit(SBox_output)
attack.setAnalysisAlgorithm(CPAProgressive, leak_model)

attack.setTraceStart(0)
attack.setTracesPerAttack(50)
attack.setIterations(1)
attack.setReportingInterval(10)
attack.setTargetSubkeys([0, 1, 2, 3, 4, 5, 6, 7, 8, 9, 10, 11, 12, 13, 14, 15])
attack.setTraceSource(self.ppmod[0])
attack.setPointRange((0, 3000))

self.results_table.setAnalysisSource(attack)
self.correlation_plot.setAnalysisSource(attack)
self.output_plot.setAnalysisSource(attack)
self.pge_plot.setAnalysisSource(attack)
attack.processTraces()
You can see this script has several sections:
- Imports for needed functions.
- Loading of project (if using a project from disk) & setting of trace information.
- Configuration of attack.
- Connecting output (drawing) widgets to the attack.
- Running the attack.
If you need to modify the script, you can edit the file in an external editor. You will need to ensure your system is configured to open your preferred editor on ".py" files, OR configure the editor under Help --> Preferences.
The default options should work, but you can modify for example the Reporting Interval to see more detailed graphs.
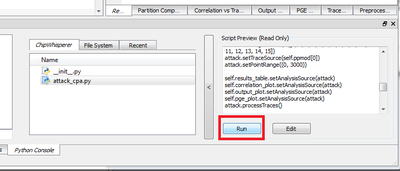
Finally run the attack by switching to the Results Table tab and then hitting the Run button with the script selected:
If you adjusted the Reporting Interval to a smaller number such as 5, you'll see the progression of attack results as more traces are used. If not you should simply see the final results, which should have the correct key highlighted in red. In the following case the correct key was recovered:
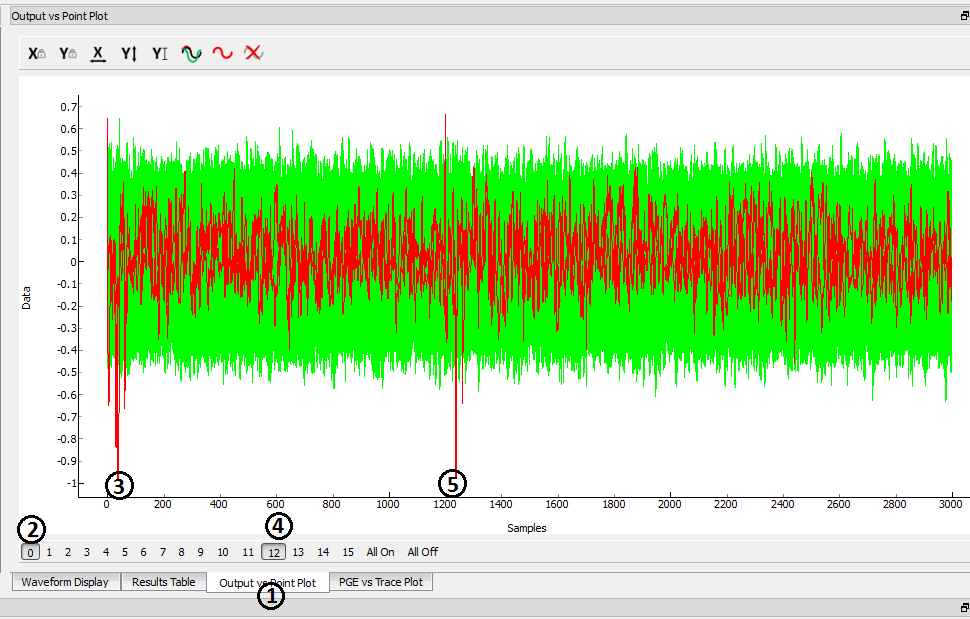
You can also switch to the Output vs Point Plot window to see where exactly the data was recovered:
- Switch to the Output vs Point Plot tab
- Turn on one of the bytes to see results.
- The known correct guess for the key is highlighted in red. The wrong guesses are plotted in green. You can see that the attacked operation appeared to occur around sample 40 for key 0. Remember you can click-drag to zoom in, then right-click and select View All to zoom back out.
- Turn on another byte to see results for it.
- This byte occured much later - sample 1240. By exploring where the maximum correlation was found for the correct key-guess of each byte, you can determine where exactly the attacked operation occured.
Next Steps
This has only briefly outlined how to perform a CPA attack. You can move onto more advanced tutorials, especially showing you how the actual attack works when performed manually.
